
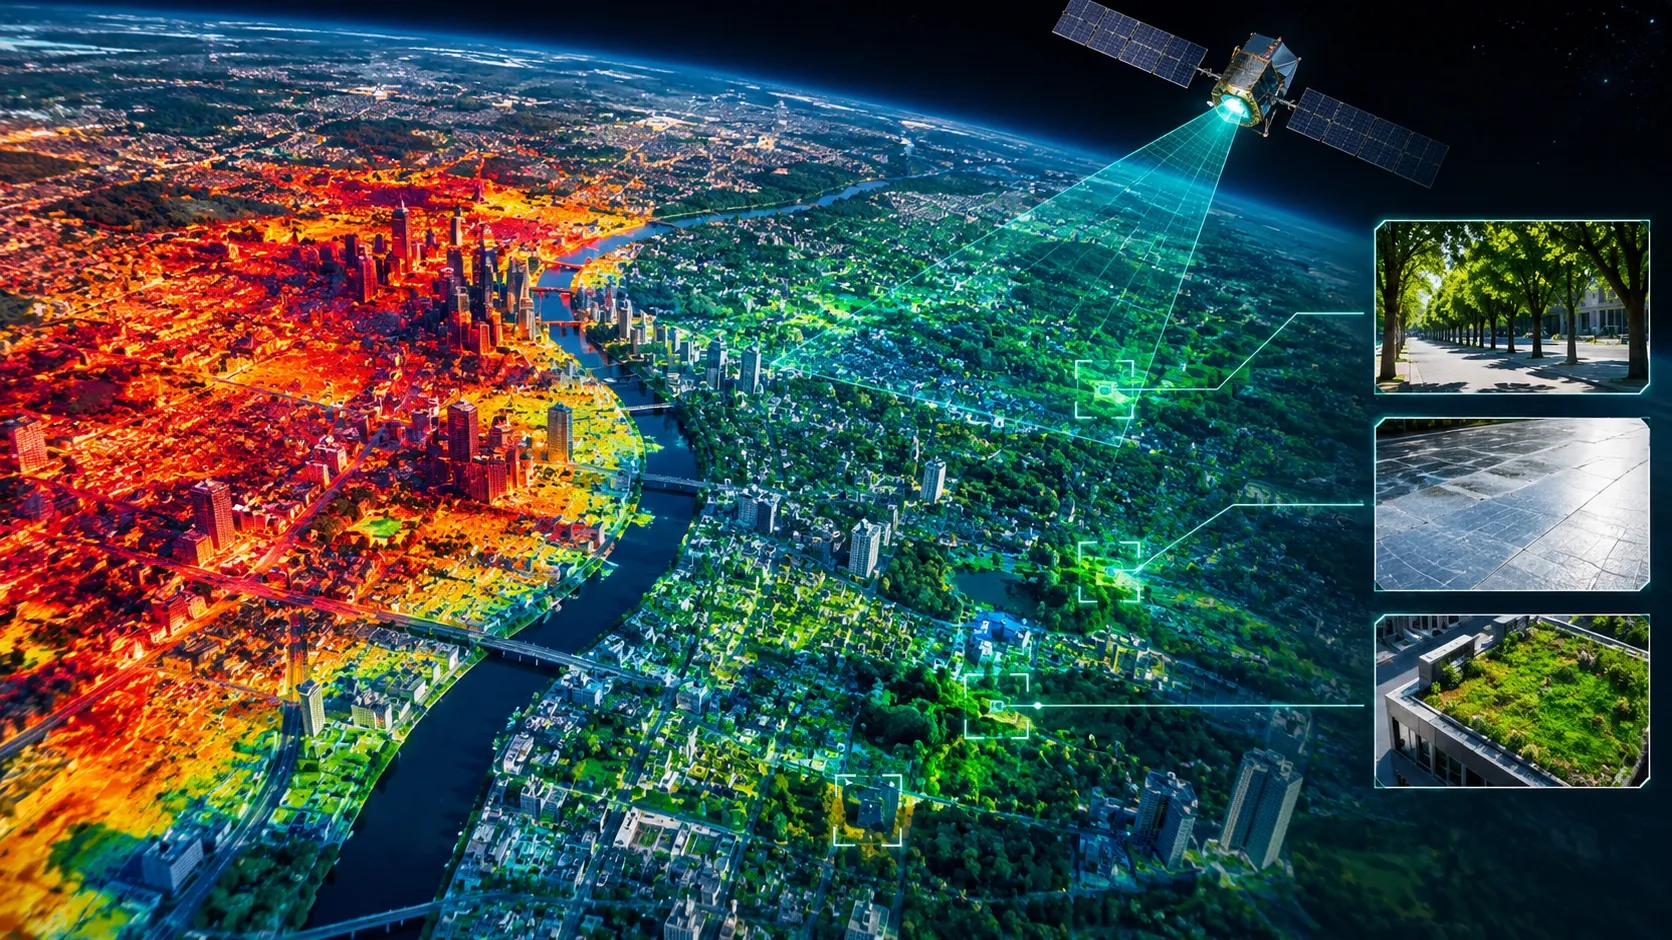
The figures behind the maps
Satellite thermal maps rank city blocks by the heat their surfaces hold, and the ranking is most useful after dark, when pavement and roofs give back what they absorbed. The maps measure surface temperature, which differs from the temperature a person feels, and clouds, coarse pixels and revisit gaps limit them. They work best as a screening layer that tells a city where to look first, with ground measurements and before-and-after tests deciding what to build.
What the sensors can see
Three families of thermal satellite data cover most urban heat work, and they differ mainly in how sharp and how frequent they are.
NASA's ECOSTRESS instrument, mounted on the International Space Station, reports land surface temperature at 70 meters. Its orbit drifts through the day, so it observes at different hours, including at night, and it revisits a given place every few days between 52 degrees north and 52 degrees south. Landsat's thermal bands are captured at 100 meters and delivered resampled to 30 meters, with Landsat 8 and 9 together covering the Earth every 8 days. An older workhorse, the MODIS sensor, observes at 1 kilometer, around 1:30 in the afternoon and again at 1:30 in the morning.
On the firm's arithmetic the gap between these scales is large. A 70-meter pixel covers about 4,900 square meters, roughly half the area of a Landsat thermal pixel, and one MODIS pixel holds about 200 of them. A city block sits near the 100-meter scale, so only the first two sensors can speak to individual blocks.
The 2018 ECOSTRESS imagery of Los Angeles shows what that resolution adds. NASA's Jet Propulsion Laboratory reported that the hottest surfaces at 4:07 in the morning were unshaded dark asphalt: freeways, airports, oil refineries and parking lots. Roofs cooled much faster than roads overnight, which JPL attributes to the higher heat capacity of asphalt. The hottest single reading, 147.3 degrees Fahrenheit, came at 3:01 in the afternoon on July 31 over the parking lot of a racetrack in Arcadia.
A heat map ranks places. It does not say what to build there.
How cities are using the maps
The clearest uses so far are in Los Angeles and in a county on the edge of Washington, DC.
Greg Spotts, chief sustainability officer of the Los Angeles Bureau of Street Services, has described the city's paving and other hardscape as a heat source that keeps radiating into neighborhoods through the early morning hours. The city's cooling work has run in stages: pilots that began in 2015 with a single parking lot, a reflective coating on one block in each of its 15 council districts, and a program announced in 2021 to coat 200 blocks and plant up to 2,000 trees across eight underserved neighborhoods. That status is as of 2021 reporting and may have moved.
In Prince George's County, Maryland, scientists at NASA's Goddard Space Flight Center worked with the county health department on a study published in 2025. It combined MODIS records from 2002 to 2023 with Landsat 8 thermal data at 30 meters, and found that summer surface temperatures in developed areas ran above 90 degrees Fahrenheit by day, more than 10 degrees warmer than undeveloped land, and stayed 5 to 10 degrees warmer at night. The hottest zones lay inside the Capital Beltway and along the Interstate 95 corridor to the north. As the paper is summarized, the county landfill is the largest area of worsening heat on county-owned land and a prime candidate for combined heat and stormwater remediation. The county's climate plan calls for using such maps, alongside ground monitoring of air temperature, to flag hot spots in development reviews.
Where the maps stop
The data describe surfaces, and cities need conclusions about people.
JPL is explicit that ECOSTRESS measures the temperature of a surface, the one you would feel by touching it, and not the air temperature that weather stations report. The Maryland study quantifies the gap: satellite surface readings ran 12 to 17 percent warmer than the maximum air temperature at four county stations, with correlations between 0.88 and 0.95. A correlation that high makes the maps reliable for ranking places. It does not make them reliable for absolute temperatures, and the study's authors say they have greater confidence in relative values than in absolute ones.
Clouds are the second limit. About a quarter of summer observations in the Maryland study were lost to them, and 2020 had no cloud-free Landsat scene at all. Continuity is the third. The instrument team's 2024 documentation said that operation beyond fiscal 2026 would be decided in NASA's senior review, and the sources reviewed do not confirm the outcome.
What the response delivers
Ranking blocks is the easy half, and the evidence for the cooling measures is more mixed than the maps.
Reflective pavement coatings are the best documented. A light coating about 100 microns thick can reflect as much as 40 percent of sunlight, against asphalt that absorbs up to 90 percent, and the 2021 reporting on the Los Angeles and Phoenix pilots cited surface differences of roughly 5 to 10 degrees. Phoenix put the cost of its coating at about $5 per square yard against $4.40 for standard sealant, a premium of about 14 percent on the firm's arithmetic. The same reporting noted that reflectivity can fall from about 40 percent to 20 percent as the surface gets dirty.
The pedestrian result is where field studies split. A 2019 field study in Los Angeles found coated asphalt 4 to 6 degrees Celsius cooler at the surface, but mean radiant temperature over the coating ran about 4 degrees higher at midday and afternoon air was only about 0.5 degrees cooler. A later neighborhood-scale study in Los Angeles reported a mean afternoon air difference of about 0.4 degrees Fahrenheit and a lower radiant temperature in side-by-side comparisons. Both sets of figures come from secondary coverage, the later study was funded by a coating supplier that says it had no role in the analysis, and the two used different products and settings.
| Claim | On the record | Still open |
|---|---|---|
| Satellites show where heat concentrates | Los Angeles imagery from 2018 and a 2025 county study show built surfaces warmest, including at night | Air temperature and exposure at street level; clear-sky coverage |
| Maps can steer where cooling goes first | City and county plans use or call for heat rankings to prioritize sites | Measured results after the projects are built |
| Cool pavement lowers surface heat | Surface temperatures 4 to 6 degrees Celsius lower in a Los Angeles field study; pilots report differences of roughly 5 to 10 degrees | Pedestrian exposure, where studies disagree; reflectivity that can halve with dirt |
| Trees and green cover cool neighborhoods | Los Angeles plans up to 2,000 trees in eight neighborhoods; the county study favors converting paved surface to canopy | Survival, upkeep and cooling per dollar |
| The data will stay available | 70-meter surface temperatures have been collected since 2018 | Mission continuation beyond fiscal 2026 |
What it means for property and infrastructure
Heat is becoming a measurable attribute of a block, and the screening layer is open data.
A ranking built from NASA imagery costs little to produce, which lets any owner or lender see which parcels sit in the hottest part of a city. The firm's reading is that the valuable step is the one after the screen: overlaying the ranking with who lives there, what the buildings are, and what a fix costs. Los Angeles research points to why that matters, with daytime surface temperature across the metro area correlating negatively with median household income in a 2025 analysis, so the hottest blocks tend to be where residents have the least to spend on cooling.
Surface temperature tells you which block is hottest. It cannot tell you who is outside on it.
What to watch
A short list of measurements will show whether heat maps change outcomes for people.
Before-and-after air temperature
Street-level readings at treated and untreated blocks, which settle what a surface reduction is worth to a resident.
Pedestrian exposure
Mean radiant temperature over reflective surfaces, where the field studies still disagree.
Durability
How much reflectivity a coating keeps after one and two years of dirt and traffic.
Mission continuity
Whether the space station imager keeps flying past fiscal 2026, and whether a successor thermal mission is funded.
The health link
County heat-illness records joined to the hot-spot maps, which the Maryland study lists as a next step.
Conclusion
Satellite thermal data have given cities a cheap, repeatable way to see where heat accumulates, and Los Angeles and a Maryland county show how the rankings can steer cooling work. The firm's view is that the maps answer the question of where to look and leave open the question of what works: surface readings, cloud gaps and coarse pixels limit them, and the field evidence on cooling measures is still split. The projects that will matter are the ones that measure what residents feel before and after.
The satellite finds the hot block. The thermometer at head height decides whether the fix worked.
Sources: NASA Jet Propulsion Laboratory release on ECOSTRESS imaging of Los Angeles (2018-09-18); NASA ECOSTRESS and Landsat product documentation; Frontiers in Environmental Science (2025), "Applying global NASA data to local planning for extreme heat in Prince George's County, Maryland" (figures as summarized); American Society of Civil Engineers reporting on cool pavements (2021); published field studies of reflective pavement in Los Angeles and Phoenix (figures as reported in coverage). Figures described as the firm's arithmetic are illustrative derivations from publicly reported values and are not forecasts. For informational purposes only; not investment advice.